Rural NV Economic Benefits of Climate Policy
See the new study from CCL’s Jerry Hinkle: Rural Economic Benefits of Climate Policy
Climate policy outreach, especially to conservatives, is the significant economic boost to rural areas owing to the buildout of wind and solar energy. CCL Research has derived estimates of the annual revenues that would accrue to congressional districts and states as a result of one sample climate policy.
See If Your Congressional District Benefits
Use the links below to access the Google Drive folder containing your district or state-level report.
Background
As described in an extensive report by RMI, an independent, non-partisan consultancy, policies that would reduce carbon emissions, including carbon pricing, would significantly boost American rural economies. Such a policy would increase investment in utility-scale wind and solar power in the U.S., and up to 99% of these renewable projects would be sited in rural communities.
If climate policies are sufficiently ambitious[i], total revenue from wind and solar projects would rival those from major cash crops (beef, corn, and soy) by 2030 and exceed them thereafter. This revenue would be as stable as electricity usage, generating a far more consistent source of needed income for these communities than products subject to commodity price fluctuations.
The buildout of renewable energy would generate a consistent source of revenue simply from constructing, hosting, and operating the wind and solar energy facilities. This would generate four clear sources of stable revenue for the rural communities:
- Tax payments: local taxes from wind and solar projects would allow town and county governments to invest more in public services and school districts or to lower other taxes.
- Land lease payments: rural landowners will make money leasing portions of their property for wind and solar projects.
- Construction wages: the construction of the wind and solar projects will bring significant job creation and wage revenue to the communities hosting the projects.
- Operations and maintenance (O&M) wages: an O&M workforce will be needed to support new wind and solar capacity on an ongoing basis, also yielding significant job creation and revenue.
Estimates of Direct Annual Revenue for Rural Communities
The National Renewable Energy Lab (NREL) has constructed a set of highly detailed models that evaluate the cost of generating wind or utility-scale solar power in over 250,000 locations in the continental U.S. With this information, estimates can be derived as to the amount of renewable energy capacity that can be installed and electricity produced within a given area as a result of a specified policy that encourages renewables, such as a carbon tax. These estimates assume that the lowest-cost solar and wind projects are developed first.[ii]
CCL hired University of Pennsylvania Research Affiliate Kevin Ummel to utilize these state-of-the-art models to generate estimates of how much direct annual revenue would accrue to each congressional district under a climate policy scenario that most resembles a carbon tax. He describes the scenario as follows:
“The most aggressive decarbonization scenario currently available in Cambium [an NREL model] is the “Lower RE Costs, High Electrification” scenario developed for the Electrification Futures Study (EFS). It pairs lower-cost renewable energy technology with an increase in electricity demand (e.g. adoption of electric vehicles). The least-cost solution in this scenario includes large-scale build-out of wind and solar technology and results in power sector CO2 emissions falling ~62% between 2020 and 2034. Although this scenario does not include explicit carbon pricing, by assuming lower renewable power costs (relative to fossil fuels) it likely reflects the key supply-side effects of aggressive carbon pricing.”
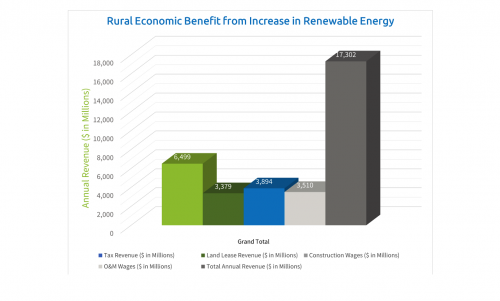
 In this particular EFS scenario (link here), renewable energy capacity expands from 212 gigawatts (GW) of electricity in 2020 to 982 GW in 2034; an almost fivefold increase. The average direct revenue to rural communities from adding this 760 GW of electric capacity is $17.3 billion every year (see graphic, right). This is comprised of the following:
- $6.5 billion in local tax payments,
- $3.4 billion in land lease payments,
- $3.9 billion in construction wages, and
- $3.5 billion in O&M wages.
Total Economic Benefit to Rural Communities
It’s important to understand that the total economic benefit to these rural communities includes this direct revenue plus indirect benefits, and so would be several times the $17 billion. The reason is that most of the $17 billion in new revenue is then spent in these communities, and this generates additional economic activity. For example, the tax revenue is either spent on new schools or roads, generating additional wages and other revenue, which is also then spent or used to lower other taxes (i.e., sales or property taxes). This leaves more money in the community for residents to spend on other products. Similarly, the construction and O&M wages reflect the additional jobs and revenues that flow through the local economy, and this money is then spent on food, housing, and the like, which generates additional jobs and revenue. Though the indirect revenues are not easily estimated, the total revenue increases to rural communities should be several times the direct benefits.
Notes on Our Advocacy
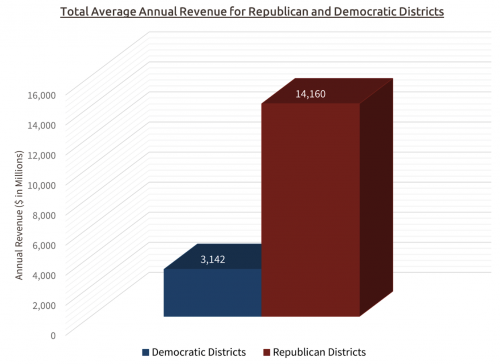
 There are two more important elements of this analysis that are pertinent to our advocacy. First, congressional districts that are represented by Republican lawmakers receive the overwhelming majority of these financial benefits. Because they accrue to rural areas, and predominantly rural areas are more often represented by Republicans, congressional districts represented by Republicans receive 82% of the direct annual revenue (see graphic, right). Advocates to conservatives: take note, as this information may be especially useful in your efforts.
Second, as reflected in the Columbia Report modeling the Energy Innovation and Carbon Dividend Act, at least for the first 10 years and possibly longer, the increase in renewable energy capacity does not reduce the production of either US natural gas or oil (see the section titled Energy Production Implications). This is because the new wind and solar energy primarily replace coal production and imported oil. Representatives concerned about the loss of natural gas or oil production should be made to understand this.
Tools for Advocacy
To facilitate the use of this information in our advocacy, CCL has compiled a set of tools. Because the increase in renewable generating capacity is not significant in all congressional districts and states[iii], CCL set a “materiality threshold” so as to produce results only for areas that exceed a specified level[iv]. Essentially, results are only generated for areas that are estimated to accrue above-average direct benefits. For each of these districts volunteers have access to the unique 2-page “leave behind” reports listed above that provides a description of the rural economic benefit and the estimate for that specific area and the CCL Training page that describes the estimates, how they were produced, and how to utilize them in advocacy.
Further questions should be directed to jerry@citizensclimatelobby.org.
Notes for Liaisons: All 4 of Nevada’s Congressional Districts Benefit
Footnotes:
[i] This statement, from the RMI study linked above, utilizes a scenario from the 2035 Report, a report released in 2020 by UC-Berkeley and GridLab that assessed the potential for the U.S. grid to be reliably powered by 90% carbon-free energy in 2035.
[ii] Actual results will differ somewhat, especially as it will be up to the individual landowners to decide what they do with their land. Assuming firms and people always act to optimize financial wellbeing is usually necessary to conduct the modeling, but things are less simple in reality.
[iii] For example, 160 congressional districts were estimated to have no increase in renewable energy capacity as a result of the policy.
[iv]For States we used Annual Income greater than or equal to 0.05% of GDP as a threshold, whereas for congressional districts we used Annual Income greater than or equal to 0.09% of Total Household Income.

