Chart: The US hits new highs for oil and gas production
It’s the hottest year on record, and the U.N. just set a global goal to phase out fossil fuels — but the U.S. is drilling for more oil and gas than ever before.

Canary Media’s chart of the week translates crucial data about the clean energy transition into a visual format.
COP28 concluded last week with what many called a “historic” achievement: The final agreement signed by all countries included language explicitly calling for “transitioning away from fossil fuels.” It might seem like a pretty obvious goal to emerge from a gathering on fighting fossil-fuel-induced global climate change, but this was the first time in the conference’s 28 years that such language has appeared in a final agreement.
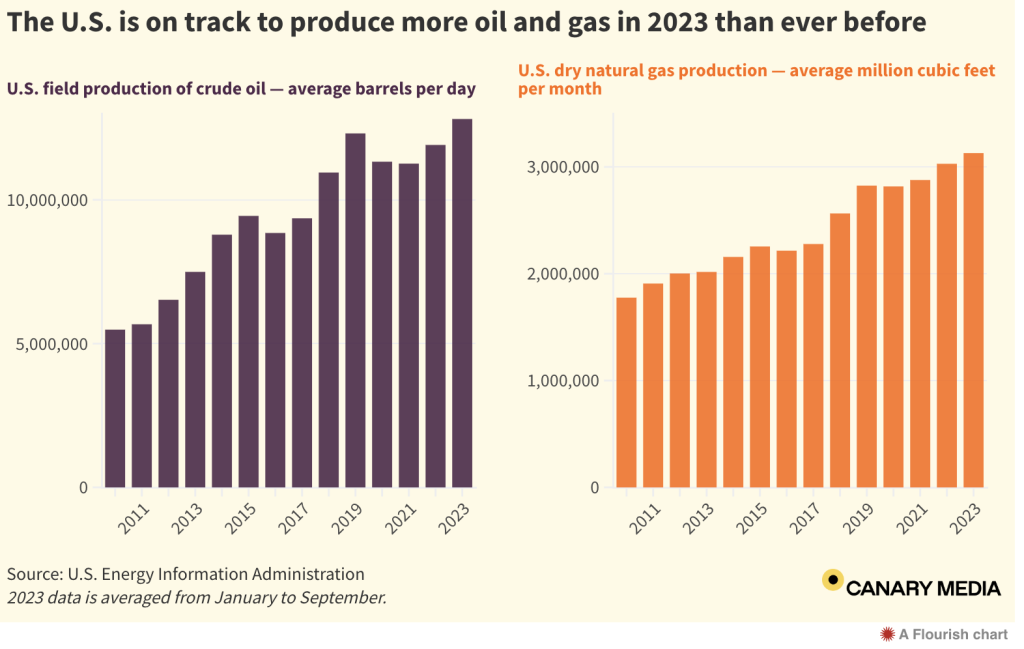
Yet the United States — despite signing on to the COP28 agreement along with 196 other nations — is on track to produce more oil and gas than ever before this year.
According to data from the U.S. Energy Information Administration, the U.S. produced an average of 12.8 million barrels of crude oil per day from January through September of this year — more than double the 2010 average of 5.5 million. And the EIA has forecast even more crude oil production next year: an average of 13.1 million barrels a day, driven by export demand.
The U.S. also hit a new record for average monthly production of consumer-grade fossil gas during the first nine months of 2023 — 3.1 trillion cubic feet. That is 76 percent more than the nearly 1.8 trillion cubic feet the country produced each month on average in 2010. Much of the demand growth came from Texas and Louisiana, states with terminals that have been exporting increasing amounts of liquefied natural gas, or LNG, since 2016.
The higher levels of oil and gas extraction in 2023 cement the U.S.’ lead as the top global producer of both fossil fuels — at a time when the world needs to be decisively and rapidly shifting to clean energy.
If you enjoyed this story, help us produce more like it. Donate to support Canary Media!


