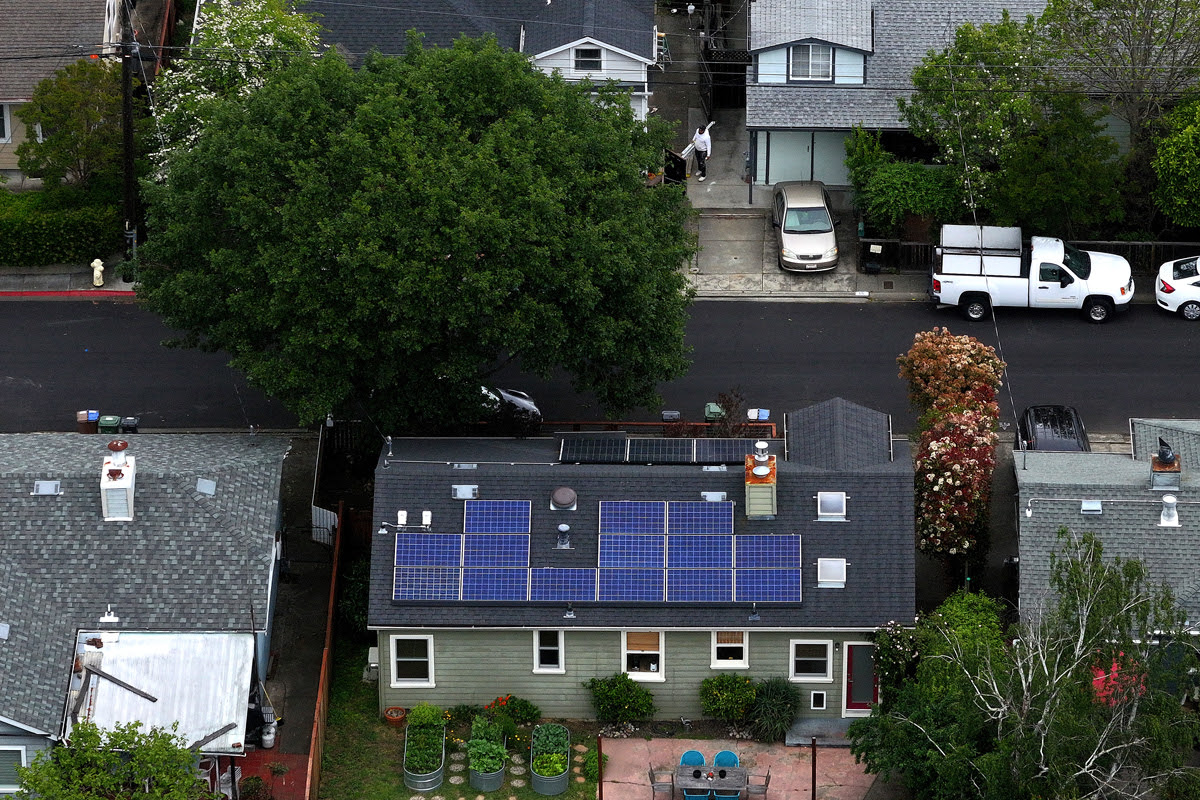
rooftop solar

Rooftop Solar Costs Decline as Efficiency Improves

from Inside Climate newsletter

EcoTech Note:  “OK, let’s rise above principle, now, and talk about money,” my teacher once presciently said.  “That explains more.”   I think of that whenever I read this newsletter, which gets into the nitty gritty – like these points:

  • Lawrence Berkeley Lab published its annual “Tracking the Sun” report on customer-owned solar. The report shows continued growth of panel efficiency, a drop in prices and an increase in solar systems that are paired with battery storage.
  • The report is based on a sample of 3.7 million customer-owned solar systems, about three-quarters of the total installed in the United States.  Installed cost/watt is $4.20 nationally, with wide variation by state, mostly driven by “soft costs” like labor, financing and permits.  (Nevada is  at $3.40/watt and Utah is at $5.20.)

  • A co-author of the report highlighted the increasing size of new installations as key point: “Customers are able to meet more of their load and save more on their bills,” he said.

Your roof isn’t getting any bigger, but the amount of electricity that can be produced by solar panels up there has grown by a lot compared to a generation ago.

New figures from Lawrence Berkeley National Laboratory show how much: The median size of a residential solar system grew from 2.4 kilowatts in 2000 to 7.4 kilowatts in 2023.

Size, in this case, refers to the generating capacity of a solar system, not its surface area. The tripling of median size, despite the surface area of a typical roof not changing much, is a boon for consumers and the grid.

Lawrence Berkeley Lab published a trove of data last week as part of the annual “Tracking the Sun” report on customer-owned solar. The report, which looks at data from 2023, shows a continuation of major trends like the growth of panel efficiency, a drop in prices and an increase in solar systems that are paired with battery storage.

Prices and system size had only tiny changes from 2022 to 2023. Median size increased by 0.1 kilowatts. Median price was $4.20 per watt, down from $4.30 per watt, adjusted for inflation.

Solar Systems Keep Growing

The report is based on a sample of 3.7 million customer-owned solar systems, about three-quarters of the total installed in the United States.

To get a better sense of progress, it helps to take a longer view. I asked Galen Barbose, a staff scientist at Lawrence Berkeley Lab and co-author of the report, which long-term trends he finds the most striking. He pointed to the growth in system size.

“Customers are able to meet more of their load and save more on their bills,” he said.

The increase in system size is closely related to improvements in solar panel efficiency, a measure of how much of the solar radiation shining on a panel’s surface is converted to electricity.

Last year, more than 90 percent of solar panels had efficiency of at least 20 percent, which is remarkable considering that no residential panels had that level of efficiency as recently as 2011, according to the report. The rapid shift follows technological change, such as the development of “TOPCon” solar panels, which have a mix of materials that achieve greater efficiency with minimal increase in costs.

Solar Price Keep Falling

Even as residential solar prices continue to decline, the United States has high prices relative to peers. Prices in Australia, for example, have fallen to less than $1 per watt. Energy analysts have asked why there is such a large gap between the United States and Australia.

“It’s undeniable that residential [solar] prices in most of the other markets are way below the U.S., and that has to do with soft costs,” Barbose said.

By “soft costs,” he means the expenses that aren’t for hard goods like solar panels and inverters. This includes labor, financing and permits, among others, and it’s included in calculations of the cost per watt.

Driving down soft costs is complicated and difficult, and it’s sometimes in conflict with the idea that solar industry jobs should have high pay and good benefits.

The report helps me to appreciate the challenge of driving down costs because of the way it shows the range of prices. Nationally, the middle 60 percent of projects—from the 20th percentile to the 80 percentile—have prices that range from $3.20 to $5.50 per watt, which is a lot of variation.

Prices vary significantly by state. California, the country’s leader, has a median price that’s the same as the national median, $4.20, while Nevada is on the low end with $3.40, and Utah is on the high end with $5.20.

There are many possible explanations for the differences by state, including the competitive balance of companies doing the installs, the typical sizes of projects being done and local regulations that affect costs.

Rooftop solar installation is mainly done by small- and medium-size companies, which leads to a wide variety of approaches and cost variation. The country’s top 10 installers represented a combined 36.7 percent of the market, the report said.

Here are a few additional findings:

  • More buyers are getting rooftop solar in tandem with battery storage, representing 9.4 percent of residential systems last year, up from 8.8 percent in the prior year, and up from near-zero as recently as 2015.

  • Solar leasing gained in popularity last year, with 27.4 percent of the market, up from 25 percent in the prior year. This follows about a decade of steady decreases as fewer companies have emphasized selling leases and more consumers obtained loans to buy solar systems rather than signing leases. The shift may be because leased systems are eligible for aid under the Inflation Reduction Act.

  • Solar panels usually get the most sun if they face south, and 56 percent of the systems installed last year are south-facing, a figure that is about the same as prior years. Next are west-facing systems with 23 percent, and most of the rest are east-facing.

Leave a Reply